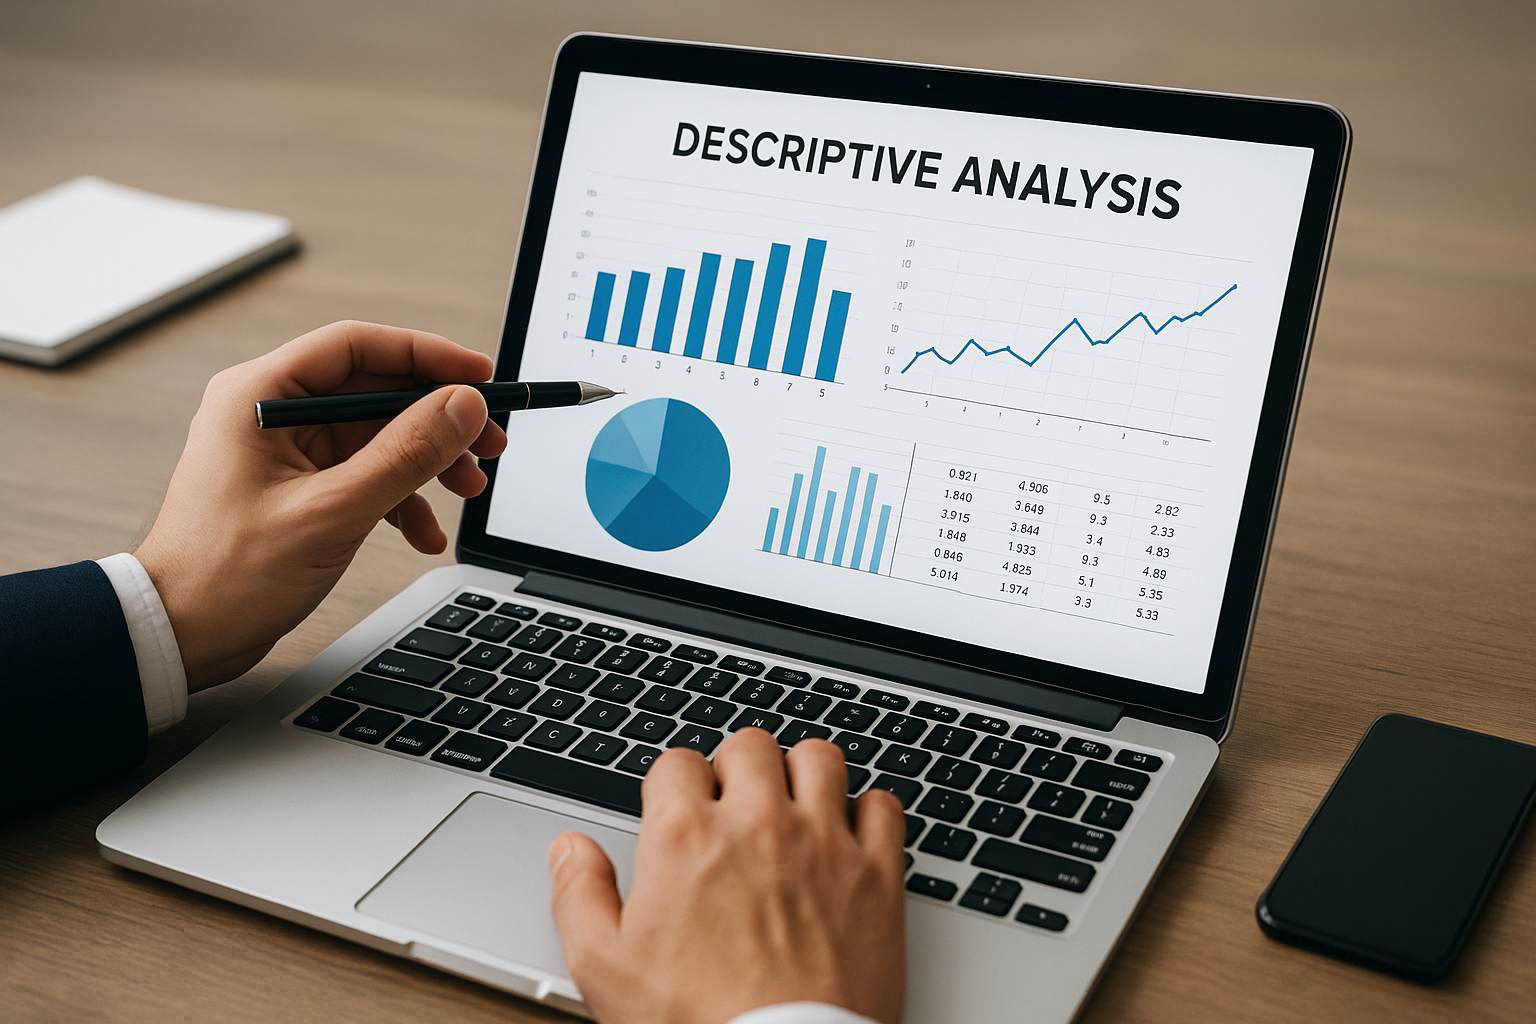
Descriptive Analysis
Our Descriptive Analysis services provide clear, insightful summaries of your historical data. We help you understand “what happened” using statistical techniques, data visualization, and business intelligence dashboards that reveal patterns, trends, and anomalies—empowering better decision-making at every level.

Key Features
- Data Cleaning & Preprocessing – We ensure your data is structured, complete, and ready for analysis.
- Statistical Summarization – Generate insights using means, medians, ranges, variances, and percentiles.
- Interactive Dashboards – Visualize KPIs and trends using charts, graphs, and drill-down reports.
- Trend & Pattern Recognition – Detect seasonality, outliers, and clusters in your datasets.
- Cross-Tabulation & Segmentation – Analyze customer, sales, or operational data by segments.
- Automated Reporting – Schedule data exports and summaries via dashboards or PDF reports.
Use Cases by Industry
Understand buying behavior, product performance, and seasonality trends. Optimize pricing, inventory, and campaigns.
Track patient outcomes, identify common diagnoses, and monitor hospital operations. Support evidence-based practices.
Summarize transaction volumes, detect anomalies, and assess financial health. Enable accurate forecasting and planning.
Monitor production KPIs, defect rates, and supply chain performance. Improve efficiency and quality control.
Analyze student performance, curriculum effectiveness, and enrollment trends. Make data-informed academic decisions.
Why Partner with Us
Our analysts are skilled in statistics, Python, SQL, Excel, and visualization tools like Power BI and Tableau.
Customized reporting tailored for your industry—ensuring relevance and actionability.
From Excel spreadsheets to big data pipelines, we adapt to your technology stack and business scale.
Integrate with APIs, CRMs, or ERPs to enable continuous insights and live dashboards.
Ensure data privacy and compliance with standards like GDPR and HIPAA.
Engagement Models
Detailed static reports and dashboards based on historical datasets.
Build interactive dashboards for business units with automated data refresh.
Monthly/weekly reporting services to track performance and trends continuously.
Integrate analysis and visualizations into your existing apps or portals.
Get expert guidance on data strategy, tools, metrics, and process improvement.